- Swingly
- Posts
- Protect Your Capital
Protect Your Capital

Swingly Exposure Status: Risk Off
OVERVIEW
The Market Listener
In reality, success in trading is as much about patience and preparation as it is about execution. It's about recognising that every moment spent analyzing and strategising is an investment in future opportunities. Just as a skilled sailor meticulously prepares their vessel before setting sail into the unknown, traders must take the time to understand market dynamics, identify trends, and anticipate potential risks.

By exercising restraint and prioritising thorough preparation over impulsive action, traders position themselves to seize opportunities when they arise. As the saying goes, "Preparation is opportunity." Those who approach the market with a disciplined and patient mindset are better equipped to navigate its complexities and capitalize on the moments when the tides turn in their favour.
During periods like these, it's crucial for the best swing traders to remember the essence of their role: listening.
Listening to the subtle cues and signals that the market is conveying is the cornerstone of effective trading.
TODAY’S OUTLOOK
Defence Pays
Large Caps: Rangebound
Today, we're adopting a risk-off stance. Our analysis suggests that the market is currently experiencing significant volatility, notably seen in the Nasdaq (QQQ), which tracks leading large-cap stocks. Despite attempts, it's still encountering resistance around the $450 breakout level, persisting in its 7-week sideways consolidation pattern.
The QQQ is currently between it’s daily 20-EMA & 50-EMA whilst additionally holding above the weekly 10-EMA. This level has significant support and therefore leads us to believe we are likely to see the area defended.

QQQ Daily Chart
Moreover, volume has shown a recent uptick in the last weeks, coinciding with the QQQ's inability to muster sufficient buying pressure to break out of its sideways trend. This dynamic signals an aggressive stance from sellers, as they assertively prevent against any upward pressure and resist buyers from breaking key levels.
Small Caps: A Pause in Growth
Analyzing the recent performance of the Russell 2000's IWM, which tracks small growth companies in the US equities market, it becomes apparent that growth names have momentarily halted their ascent.

IWM Weekly Chart
The IWM recently dipped below its 10-weekly EMA on significant volume and is currently seeking support at a long-standing level of $198.50, previously staunchly defended by sellers, requiring several years to breach.
While the 20-weekly EMA has provided support in recent months, a breach below $198.50 and subsequent failure to reclaim this level would raise concerns.
KEY PRINCIPLE
Understanding Asymmetry
In the world of trading, the concept of asymmetrical risk to reward is akin to uncovering hidden treasure amidst the tumultuous seas of financial markets.

It's the golden principle that savvy traders swear by, emphasising the art of seeking out opportunities where the potential reward vastly outweighs the risk. Picture this: risking a small sum for the chance of earning multiples in return. It's about strategically positioning oneself in trades where the odds are tilted in favour of substantial gains, while carefully managing downside exposure.
This approach isn't just about aiming for home runs; it's about consistent profitability through prudent risk management and disciplined execution. A profitable and successful trader doesn’t need to make money every week or month, they understand the asymmtry that exists in the market.
Example
Imagine you have a trading strategy that consistently provides trades with a 2:1 risk-to-reward ratio. This means that for every dollar you risk on a trade, you aim to make two dollars in profit if the trade goes in your favor.
Now, let's consider the implications of this ratio over multiple trades. Suppose you take 10 trades, and you are correct on 6 of them while being wrong on 4.
For the winning trades:
Let's say you risk $100 on each winning trade.
With a 2:1 risk-to-reward ratio, you stand to gain $200 on each winning trade.
So, for the 6 winning trades, you make: 6 * $200 = $1200 in profit.
For the losing trades:
Since you're risking $100 on each trade, you lose $100 on each losing trade.
So, for the 4 losing trades, you lose: 4 * $100 = $400.
Now, let's calculate the net profit: Total Profit = ($1200 - $400) = $800.
Even though you were right on only 60% of your trades, thanks to the asymmetrical risk-to-reward ratio, you still ended up with a net profit.
Consider this scenario: rather than the typical 2:1 risk-to-reward ratio, imagine it's amplified to 3:1, 4:1, or even as extreme as 50:1 when you start adding to positions on secondary and tertiary setups.
Recognise that in trading, the correlation between time and income isn't linear.
Why It Matters
You might be questioning why we're placing such a strong emphasis on understanding asymmetry in this pre-market newsletter.
Allow us to clarify.
Traders must recognise that the market doesn't present trading opportunities consistently every day, week, or month.
There are periods when the optimal action for a swing trader specialising in growth stocks is to exercise patience and refrain from trading. During market downturns, patiently observing market leaders during pullbacks can position traders advantageously for a subsequent rally.
When the market momentum shifts upwards, these patient traders are primed to capitalize heavily on the emerging opportunity and aggressively scale in during a time where the market is beginning it’s upswing.
KEY PRINCIPLE
Leaders Vs Laggards

The Tortoise and the Hare
Amidst the sideways, choppy market conditions and the ongoing breadth deterioration, this presents an opportune moment for swing traders to analyse which stocks are exhibiting resilience against the downward pressure of the indices and demonstrating the highest relative strength.
The stocks which are holding up the most against this pressure enter our focus list for the day/week and we observe closely.
Characteristics of a leader
The market leaders is a term we often use to describe a select few stocks which exhibit the following behaviours:
Strong Performance: Market leaders typically demonstrate a a high absolute and relative momentum in the prior market rally, outperforming their peers and the broader market indices.
Solid Fundamentals: Market leaders usually boast strong financial fundamentals, mainly exponential revenue growth, and/or a turn-around in profitability. This turn-around surprises the market and leads to an accumulation of shares.
High Relative Strength: Market leaders display high relative strength, meaning they hold up well during market downturns and exhibit resilience against negative market trends. Inside relative strength indicates their ability to maintain momentum, often reflected in their key moving averages.
Why This Matters
Understanding the outlined characteristics of market leaders is crucial for several reasons.
Foremost among these is the potential for a stock to garner institutional support.
Smaller traders and investors—those with account sizes not in the hundreds of millions or billions—possess the agility to swiftly enter and exit stocks, even small caps, without significantly impacting the market.
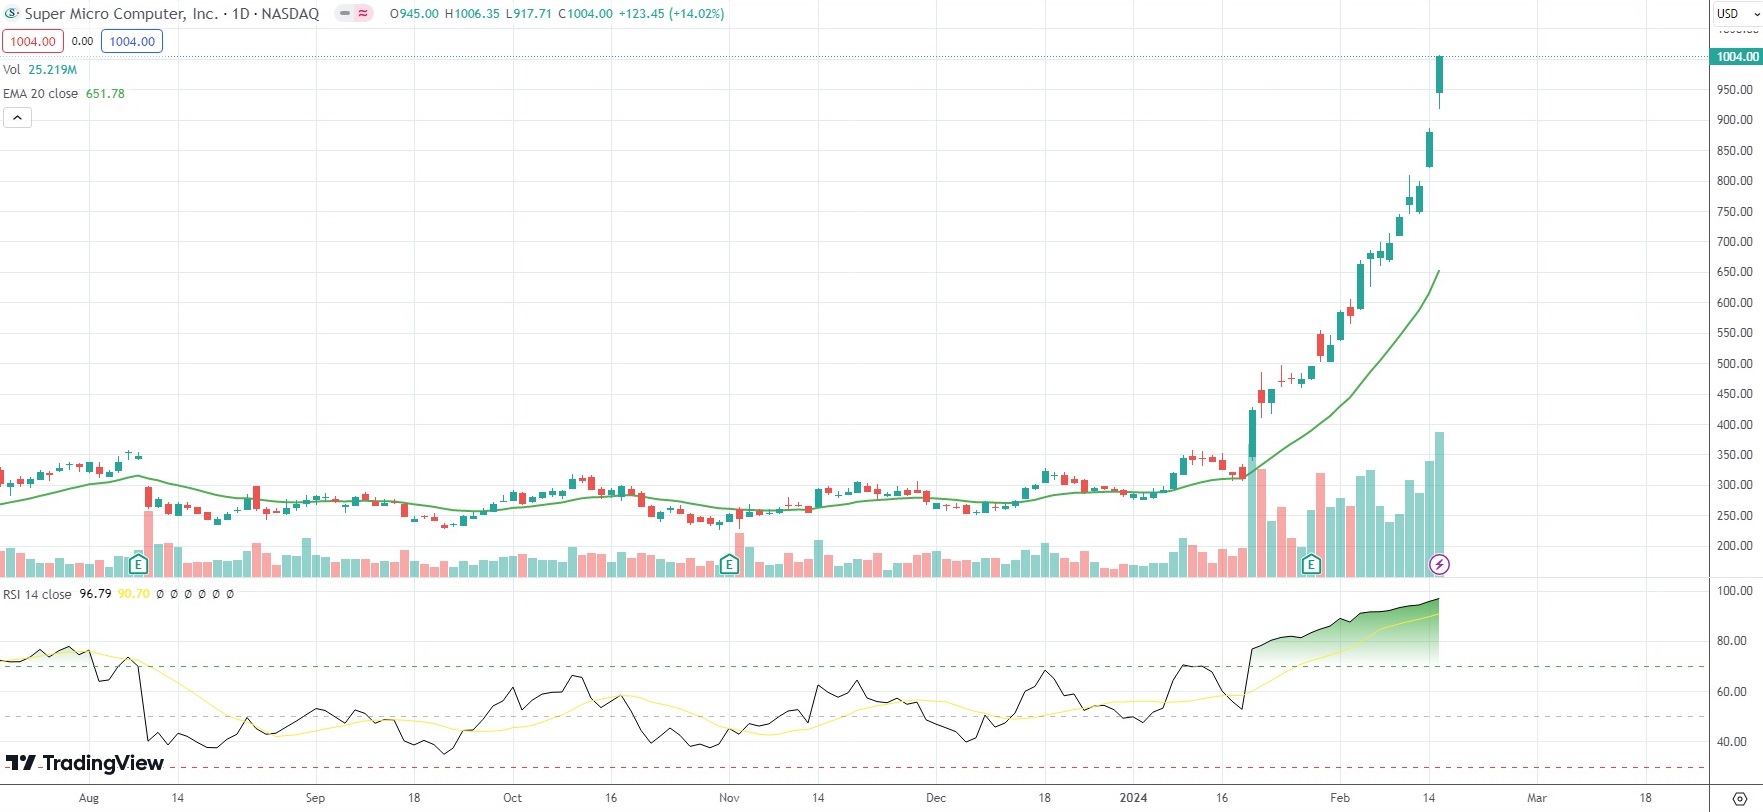
SMCI Daily Chart
When a large institution begins to accumulate a stock (as seen with SMCI last year), their footprint becomes evident. The stock experiences significant volume surges and can undergo moves of hundreds to thousands of percent over several months.
As swing traders, our task is twofold: to pinpoint stocks currently undergoing institutional accumulation (such as well-known leaders like NVIDIA, SMCI, AMD, etc.), and to identify those flying under the radar.
These "under the radar" stocks may be too small for immediate institutional interest, but their strong performance and fundamental growth (including accelerated revenue growth and earnings per share) suggest they could attract institutional sponsorship in the future.
The latter type of stocks boost the potential for significantly greater price increases in a much shorter period of time, given their often smaller market capitalisation and dependence on 'speculation money' from both retail and institutional investors
Leaders Predict The Future
For new traders, it can be a bit confusing to grasp why leading stocks often provide swing traders with insights into market movements before the major indices begin to shift.
When leading stocks start breaking out above key levels and transitioning into stage 2 uptrends, while the major indices are still in a downtrend, it often signals that the broader market is poised to reverse and move higher.
Conversely, if market leaders begin to break down while the major indices remain extended, it's typically a cue to adopt a defensive stance.
Remember that any major index (QQQ, IWM, etc.) is a combination of hundreds to thousands of different companies. Therefore, if the leading stocks are beginning to move into a stage 2 uptrend while the laggard stocks are yet to begin their upcycle, the major indices may not reflect this in their price action just yet.
PRE MARKET GAMEPLAN
Swimming Against The Current

In today's pre-market analysis, our main objective remains unchanged: to pinpoint stocks displaying remarkable resilience amid the prevailing market downtrend and spotlight them in our watchlist.
With market breadth showing signs of deterioration and the potential for a false breakout looming, we've decided to err on the side of caution.
Consequently, we will not be initiating any new positions today. This cautious approach aligns with our commitment to preserving capital during uncertain market conditions.
As we navigate these turbulent waters, it's essential to remain vigilant and flexible in our strategies. While the temptation to dive into the market may be strong, exercising patience and waiting for clearer signals can often prove to be the wiser course of action.
By staying disciplined and focusing on risk management, we position ourselves to capitalize on the opportunities when the market begins it’s next uptrend.
As swing traders, our primary objective is to prioritise capital preservation over constant exposure to the market in pursuit of gains.
WATCHLIST
Stocks To Watch
SMCI: Super Micro Computers, Inc

SMCI Daily Chart
Monitoring SMCI closely, looking for support at the daily 50-EMA and the formation of higher lows.
SMCI, a previous market leader in the AI conductor sector, serves as a valuable barometer for market sentiment and potential trends in the coming weeks.
COIN: Coinbase Global, Inc

COIN Daily Chart
Keeping a keen eye on COIN, aiming for it to maintain above the ascending support line and the daily 20-EMA.
The heightened interest in bitcoin, coinciding with its recent price surge, adds to the momentum surrounding COIN, making its performance a key focal point in the market.
OSCR: Oscar Health, Inc

OSCR Daily Chart
A former market leader, demonstrating recent new highs and currently maintaining positions above the 10, 20, and 50 daily EMAs.
Situated within the Health Services sector, known for its tendency to remain uncorrelated during market downturns.
If OSCR holds this level and moves higher, a small 0.25R position may be introduced for a quick swing trade.
GCT: GigaCloud Technology Inc

GCT Daily Chart
Also former market leader which has clear institutional sponsorship beginning from it’s earning based pivot starting late November.
Holding above key moving averages and building higher lows.
Remember
Please note that we continue to share our daily watchlist even during periods when we've signalled a 'risk-off' stance, indicating our reluctance to increase long-side exposure.
We diligently monitor these selected stocks, among others, to gauge the behavior of market-leading stocks and to ensure that during the next bull run, we possess a specific list of stocks demonstrating the highest relative strength.
These stocks are likely candidates for us to begin accumulating as the general market conditions evolve.
Did you find value in today's publication?This helps us better design our content for our readers |
Consider following us on Twitter!
Your support greatly contributes to expanding our platform and reaching a wider audience!
Twitter: @swinglyreport
Reply