- Swingly
- Posts
- Bad News For US Stocks
Bad News For US Stocks

Exposure Status: Risk Off
OVERVIEW
Just Another Bull Trap

Yesterday, the market kicked off strong, briefly surging over 2%, with the Nasdaq leading the charge. However, this momentum quickly faded, and if you followed our analysis, you’d understand why.
To be blunt, this bounce was just a low-volume relief rally. Check out the Wyckoff chart below—it clearly shows that we're in the distribution and markdown phases. The failed rally in the IWM and MDY, along with the recent "break the ice" markdown, has led us to a low-volume rally over the past 2-3 days, with declining volume.
After the initial surge, the market struggled to maintain its gains, and selling pressure resurfaced. This weakness was evident as the indices retraced their steps, and the broader market failed to build on the early strength. The lack of follow-through and declining trading volume further confirm that this was a temporary bounce rather than a genuine reversal.
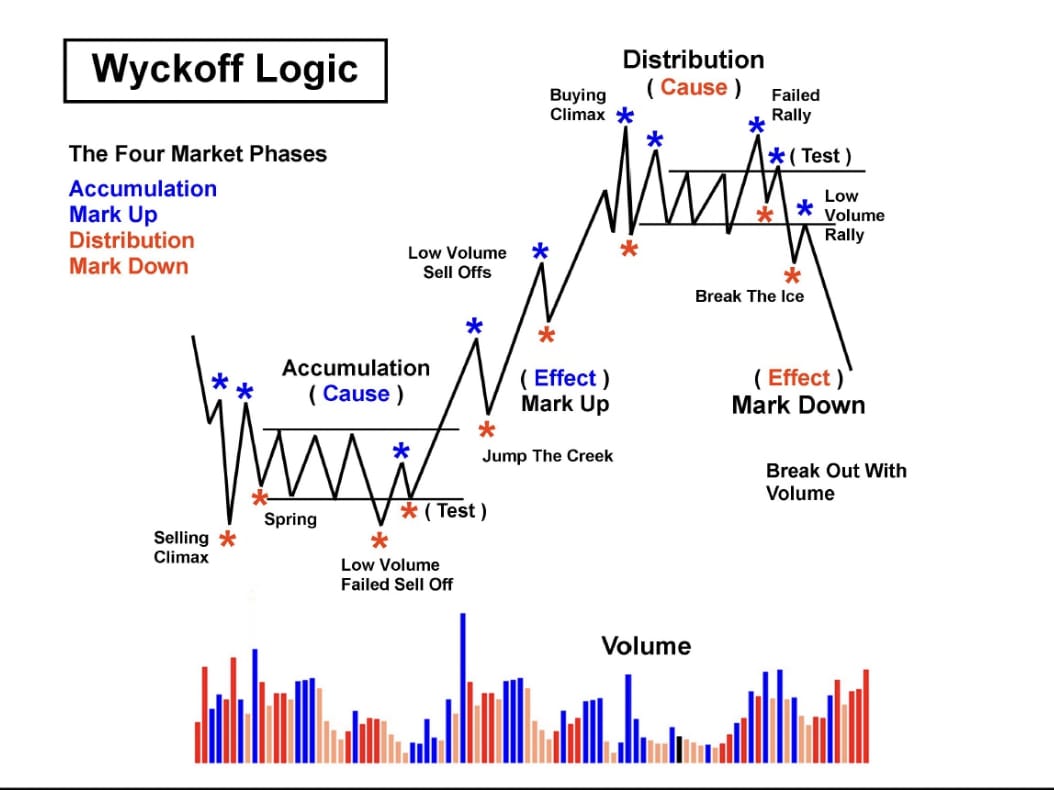
Wyckoff Logic Cycle
We expect to see volume pick up as the market trends lower into a Stage 4 downtrend and continues its markdown phase. While this might be a bit disheartening to read, it's crucial to remember that, although we can’t predict the future with certainty, it’s better to have a swift sell-off that resolves quickly than to endure weeks of market choppiness only to end up in the same markdown phase eventually.
Currently, the market is grappling with a lot of uncertainties: potential rate cuts, global equity sell-offs, recession concerns (which we don’t think are imminent), and the ongoing US presidential election cycle. All these factors are contributing to market volatility, and as a result, investors are understandably unsettled.
Nasdaq

QQQ VRVP Daily Chart
The large caps were completely rejected at the $450 supply level and the daily 10-EMA, causing the QQQ to drop below Tuesday’s lows and fall back to the daily 200-EMA at $433.
This heavy selling pressure wasn’t surprising, given that global markets are all experiencing sell-offs simultaneously.
Currently, the zone between $425 and $433 is essentially the last line of defense for the large caps. If this support fails, the next significant support level would likely be in the $400s, specifically the weekly demand zone below the 50-EMA at $412.
Ideally, we might start to see a volatility contraction pattern forming between $450 and $424, which could resemble a bear flag. Typically, this pattern leads to further markdowns.
However, if there’s a chance for a quick recovery, buyers need to see consolidation within this range to build confidence and signal that the sell-off might be over.
S&P Midcap 400

MDY VRVP Daily Chart
The midcaps failed to maintain their point of control (POC) at $534 and instead plunged towards their daily 200-EMA at $520.
The candle that formed yesterday was quite bearish: it had a long red body and closed near its low, indicating a strong downward move. This type of candle shows that sellers dominated the session, pushing prices lower and leaving little room for buyers to intervene.
Volume during this move was low, which means there wasn't a rush of new selling activity. This suggests that while the drop was significant, it may have been more about a lack of support rather than a widespread panic sell-off.
Russell 2000

IWM VRVP Daily Chart
The small caps are in a similar spot to the midcaps but with one key difference: they’re still barely holding above their point of control (POC) at $201. Right now, they’re approaching their daily 200-EMA, which is a major support level.
This is a big moment for the small caps. If the IWM can manage to stay above this 200-EMA, it might show some strength and potential for a bounce as the index is likely to chop around sideways.
The general selling pressure in equities is affecting all market cap stocks, not just the large caps. Even though interest rates are likely to come down, the ongoing selling pressure is still likely to impact small caps. The broad market weakness means that no sector is immune, and small caps are likely to feel the effects of this downward trend for a while as well.
DAILY FOCUS
A Great Time To Study Prior Winners

Right now, there are no standout opportunities in the market. Even if a setup looks promising on the surface, the risk of failure is so high—just look at EVGO’s performance yesterday—that it’s likely to lead to losses rather than gains.
We don’t want to give impractical advice, but this is actually a good time to focus on research. Our traders are doing just that—analyzing past winners, reviewing previous trades to learn from mistakes, and figuring out how to improve future returns. It’s all about preparing for better conditions down the road and making sure you're ready to capitalize on opportunities when they do arise.
We’ll be releasing an in-depth analysis on this in Swingly Pro for our readers. This upcoming deep dive will include our research, lessons from past trades, which trades we managed well and which trades we have messed up on.
We recommend you take a similar approach for your own trading. The best way to learn and improve is to create a journal of all your trades from the past quarter and analyze them thoroughly.
Keep in mind, you're not just up against other retail traders; you’re also competing with professional trading desks that spend all day not just executing trades but also honing their strategies and refining their processes.
By reviewing your own trades and understanding what worked and what didn’t, that is the only way you will actually improve yourself and your equity curve.
Ask yourself:
What was my original trade thesis?
Did the trade idea align with my overall strategy and market conditions?Did I follow my trading plan?
Was the trade executed according to my predefined plan, including entry, stop-loss, and target levels?What was the market context?
How did overall market conditions, news, or economic indicators impact the trade?Was my entry point well-timed?
Did I enter the trade at an optimal time based on technical or fundamental analysis?How did I manage risk?
Did I set appropriate stop-loss orders and position sizes to manage risk effectively?What was my exit strategy?
Did I exit the trade according to my plan or adjust my exit based on market conditions?Was there any emotional influence?
Did emotions like fear, greed, or impatience affect my trading decisions?How did I respond to the stock’s price action and volume?
Did I monitor the stock’s price action and trading volume throughout the trade? How did I adjust my strategy based on changes in volume or price behavior, and did I act on any early warning signs of a reversal or trend change?
WATCHLIST
Nothing Too Special, Yet
EVGO: EVgo Inc.

EVGO Daily Chart
The only notable flag pattern we’re seeing right now is with EVGO. The fact that it has held above its daily 10/20-EMA is a positive sign, but today will be crucial.
We need to see if it breaks below the daily 20-EMA, especially given the current shift in momentum to the downside, marked by increased selling volume and a downward price trend.
A short opportunity could present itself if the stock falls below the 20-EMA. However, we generally prefer waiting for long opportunities, as short positions are usually more suited for quick trades and day trading.
If you do consider shorting, you might target specific levels like $3.30 or even the rising daily 50-EMA.
Did you find value in today's publication?This helps us better design our content for our readers |
This newsletter does not provide financial advice. It is intended solely for educational purposes and does not constitute investment advice or a recommendation to trade assets or make financial decisions. Please exercise caution and conduct your own research.
Reply